
Streamline Your Fleet Management with the Operator Dashboard
Operator Dashboard provides easy monitoring of ongoing voyages, upcoming scheduled voyages, and any necessary actions for vessels in port.
Operators frequently manage 15 or more voyages simultaneously.
To help with that task, we have developed a feature for effortless monitoring of ongoing voyages, upcoming schedules, and required actions for vessels in port.
This feature called the Operator Dashboard, is part of the Valid Voyage solution. The Operator Dashboard leverages data from Valid Voyage advice sent to the master and actual data from noon reports.
It displays deviations in fuel consumption and distance from the advised route, calculates these metrics, and highlights them based on predefined thresholds.
The color range for distance is:
- Green represents a distance of 0 to 25 nautical miles.
- Yellow indicates a distance of 25 to 50 nautical miles.
- Red symbolizes a distance greater than 50 nautical miles.
Similarly, the color range for consumption deviation is:
- Green represents a consumption deviation of 0 to 5 percent.
- Yellow indicates a consumption deviation of 5 to 15 percent.
- Red symbolizes a consumption deviation greater than 15 percent.
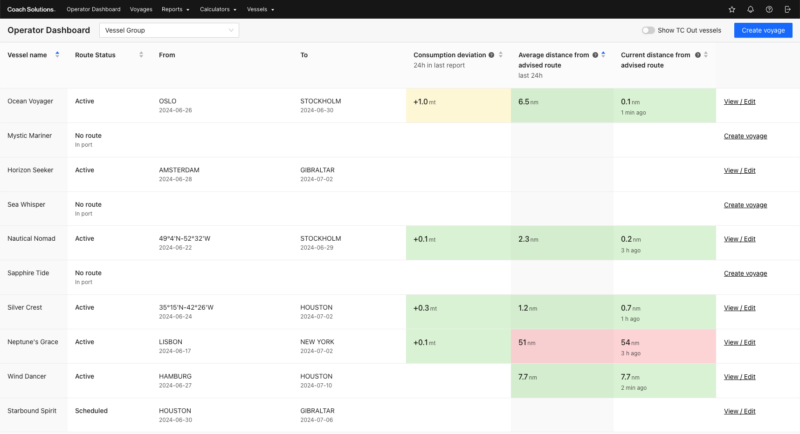
It is also possible for the Operator to:
- Create a new trip directly from the dashboard
- Edit an ongoing voyage – a redirection will take you directly to the specific voyage.
- Edit a scheduled voyage
For more information, please reach out to us.